
Figure 5.
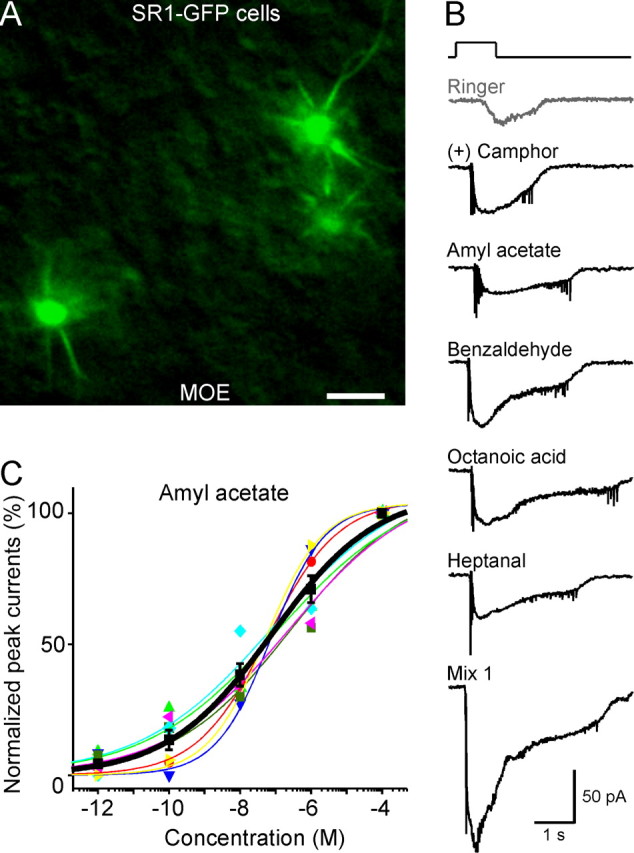
SR1–GFP cells in the MOE respond broadly and over a wide concentration range. A, Image taken under fluorescent illumination of the most ventral region of the MOE from an SR1–IRES–tauGFP mouse. Scale bar, 5 μm. B, A single SR1–GFP cell responded to all five distinct odorants at 1 μm each, and to Mix 1 at 1 μm, under voltage-clamp mode. The gray trace (Ringer) was the mechanical response induced by a Ringer puff that was delivered with the same pressure as the odorant puffs. C, The dose–response curve for amyl acetate was averaged from seven neurons. The holding potential was −65 mV for all neurons. Each colored line (and the corresponding symbols) represents the data from a single cell; the thick black line represents the averaged curve from all seven neurons. Error bars indicate SEM. Note that the averaged curve has K1/2 = 0.08 μm and n = 0.3, which are slightly different from the averaged values from individual curves reported in the text.