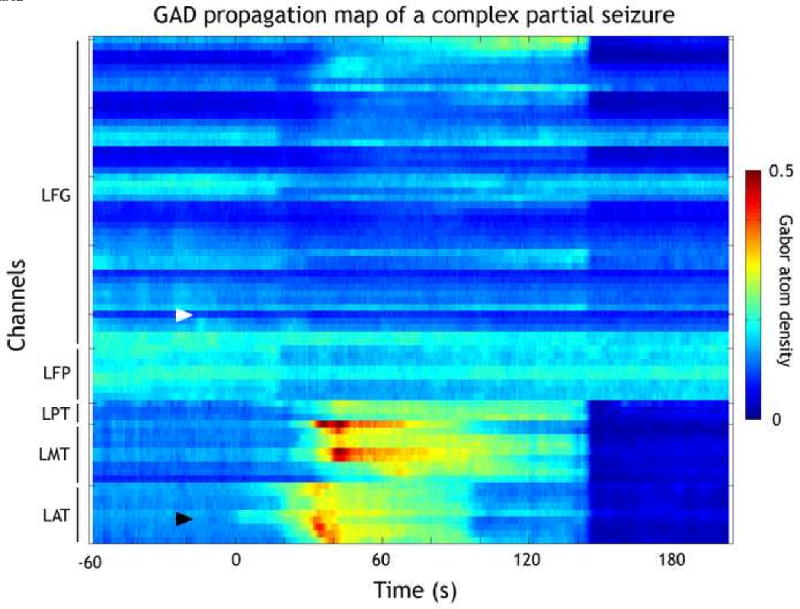
Figure 2.

Color-coded GAD propagation map for the same seizure as illustrated in Figure 1. Propagation maps are composite reconstructions of the color-coded GAD for individual channels. Black lines on left side indicate the grids/strips. LFG: left frontal grid. LFP: left fronto-polar. LPT: left posterior temporal. LMT: left mesial temporal. LAT: left anterior temporal. Zero on the horizontal axis indicates the electrographical onset of the epileptic seizure tEO. Although this is not a spatial representation of the spread over the brain, propagation maps allow us to identify the regions involved during the spread of ictal activity. Channels are listed consecutively, but on occasion consecutive channels are on opposite sides of the grid. The GAD propagation map demonstrates the focal onset (black arrow) at LAT06-07 contacts over mesial temporal regions. In addition the propagation map reveals the subsequent regional temporal lobe spread and minimal spread to frontal lobe contacts. White arrow indicates the chosen remote contact. The postictal period beginning at 145 seconds is characterized by general low complexity signals.
