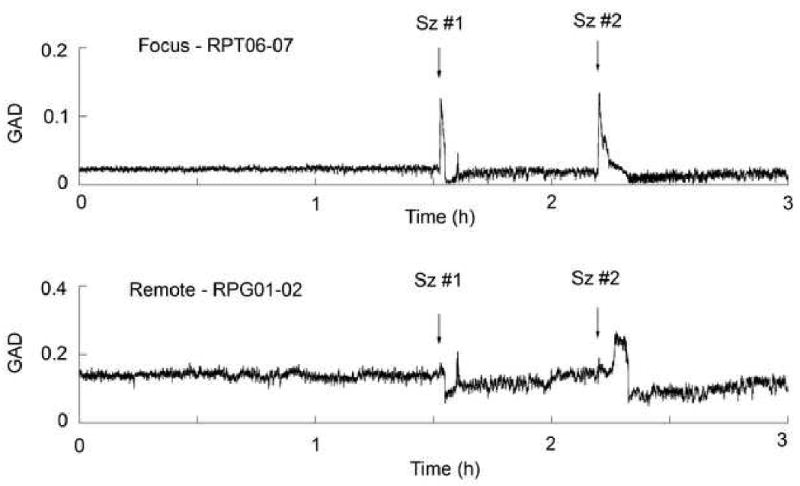
Figure 3.

Plots of the GAD levels over a 3 hour period for the focus and remote electrodes with two complex partial seizures. Arrows indicate the time of the two seizures occurring within that window. The RPT strip was over the right posterior temporal region and the RPG grid over the right parietal region.
