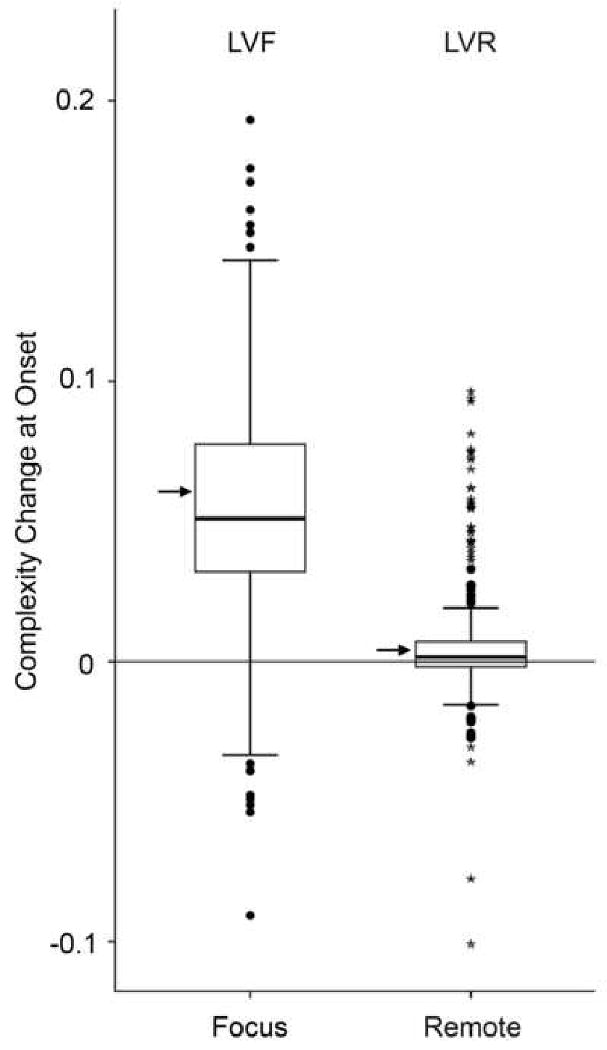
Figure 4.

Boxplots of the GAD level changes for all 330 seizures measured at the focus (LVF) and at the remote electrode (LVR). Boxes extend from the 25% quartile to the 75% quartile (this defines the inter quartile range IQR). The black bar inside box represents the median, the arrow on the side indicates the mean. Bars above and below represents 1.5 times the IQR. Dots and stars represent mild and extreme outliers (defined as outside the IQR). LVF has one extreme outlier not represented in the graph at 0.63.
