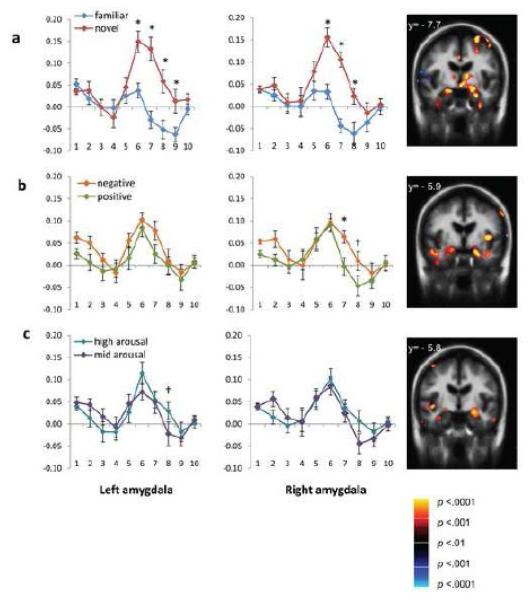
Figure 4.
Finite impulse response (FIR) models of the hemodynamic response across ten timepoints in the left and right amygdala ROIs. Volume images represent amygdala activation for each contrast at the timepoint of greatest differentiation. Panels illustrate (a) novel versus familiar timecourses and amygdala contrast at timepoint 6, (b) negative versus positive timecourses and amygdala contrast at timepoint 7 (c) high arousal versus mid arousal images and amygdala contrast at timepoint 8. Significant interactions of timepoint and affective property are denoted as follows: † p < .05; * p < .01.

