
Fig. 8.
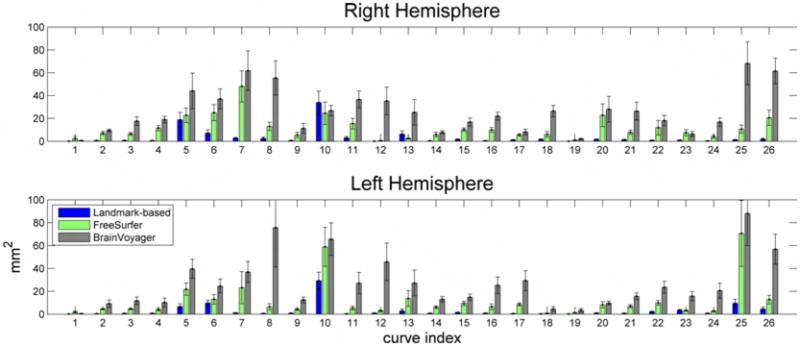
Variance of protocol curves of Group 1 after being mapped onto the target surface using the 3 registration methods. Figs. 5, 6, and 7 display the curves for the right hemisphere. Curves are numbered based on Fig. 1. The error bars indicate 1 standard error from the mean, and are calculated by bootstrapping the original curves 100 times.