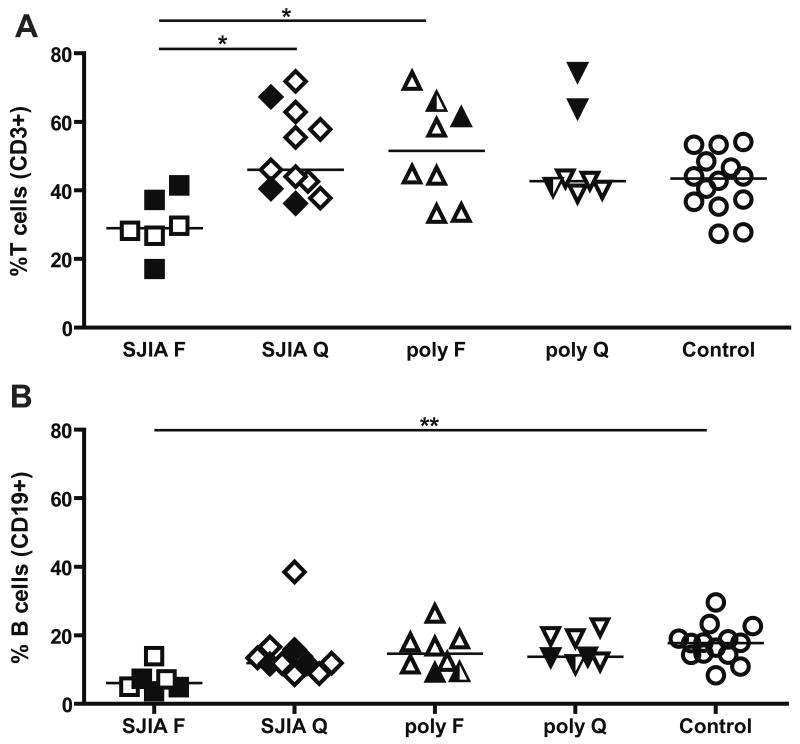
Figure 5.
T and B cell distribution in SJIA, polyJIA and controls. Data are expressed as percentage of total mononuclear cells. A: T cells (CD3+ cells). B: B cells (CD19+ cells). F: flare; Q: quiescence. SJIA F n=6; SJIA Q n=11; polyJIA F n=8; polyJIA Q n=7; Control n=14. polyJIA RF+ patients are in half black symbols. Samples with treatment intensity scores > 2 are in black.Statistical analysis used ANOVA with Bonferroni correction. *: p<0.05; **: p= or <0.01.

