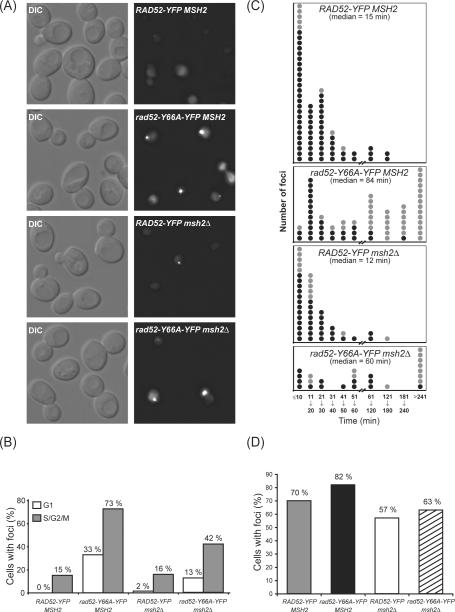
Fig. 3.
Spontaneous Rad52 foci. Diploid strains rad52Δ/rad52Δ and rad52Δ msh2Δ/rad52Δ msh2Δ transformed with a single-copy plasmid carrying either RAD52-YFP or rad52-Y66A-YFP. (A) Microscopy of cells. Spontaneous Rad52 foci can be seen in the bottom three panels. (B) Percentage of cells carrying a spontaneous Rad52 focus in unbudded (G1, white box) and budded (S/G2/M, grey box) cells. RAD52-YFP MSH2 0/358 unbudded and 67/442 budded cells. rad52-Y66A-YFP MSH2 82/220 unbudded and 346/434 budded cells. RAD52-YFP msh2Δ 3/197 unbudded and 70/432 budded cells. rad52-Y66A-YFP msh2Δ 37/293 unbudded and 219/518 budded cells. (C) Duration of Rad52 foci determined by time-lapse microscopy. Each circle represents a focus. Black circles: focus lasted within the specified category. Grey circles: focus lasted at least this number of minutes. (D) Percentage of cells that formed at least one Rad52 focus per cell cycle. RAD52-YFP MSH2 43/61 cells. rad52-Y66A-YFP MSH2 59/72 cells. RAD52-YFP msh2Δ 32/56 cells. rad52-Y66A-YFP msh2Δ 12/19 cells.

