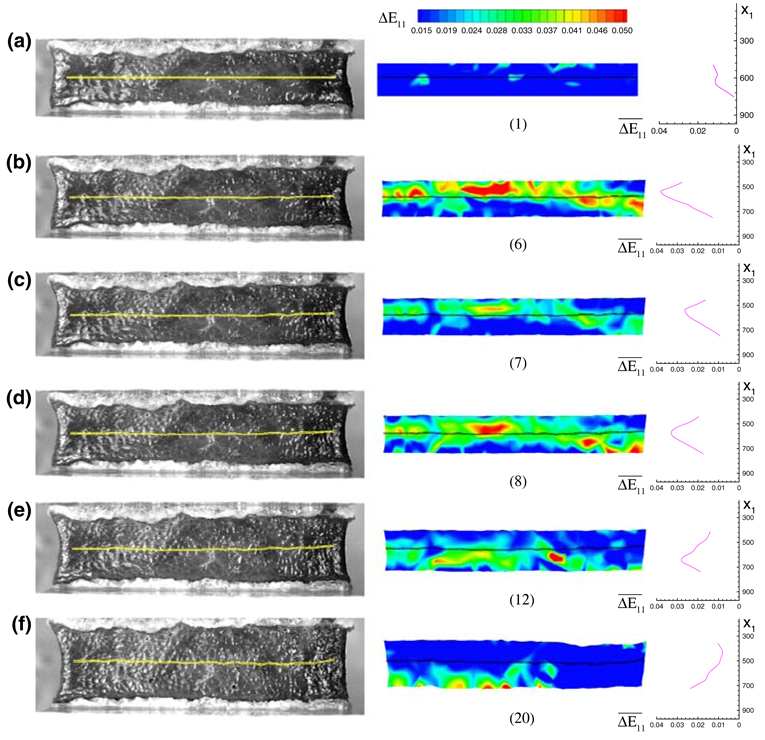
FIGURE 5.
The image, incremental strain field ΔE11 and incremental strain distribution in the direction 1 for image 1, 6, 7, 8, 12 and 20. The maximum stretching band, corresponding to the peak incremental strain position, can be seen to move downward gradually from (b) to (f). The thin region chosen to calculate strain for the stress–stretch curve was superimposed on the images and the incremental strain field. x1 is the coordinate in the direction 1 for all the three plots in a row. The unit for coordinate is pixel.

