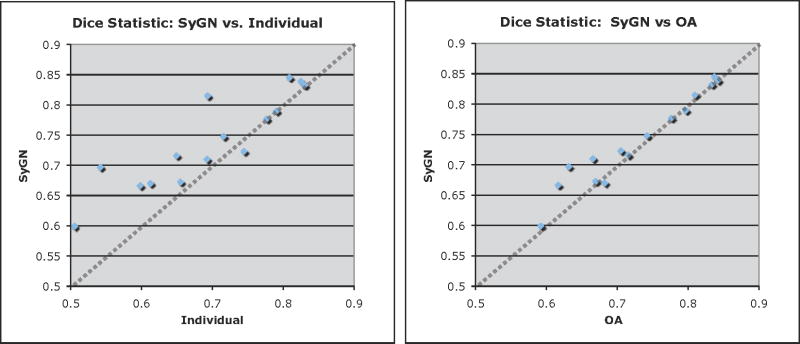
Figure 5.
We contrast the performance of OA vs SyGN and Indi vs SyGN, for segmenting the diseased-side hippocampus, by graphing their relative values. Identical performance would fall along the dotted line. SyGN, relatively, performs notably better—on nearly all data—than the individual template. SyGN’s performance is comparable to the OA template except on a few individuals where SyGN’s overlap ratio is superior by approximately 0.05.

