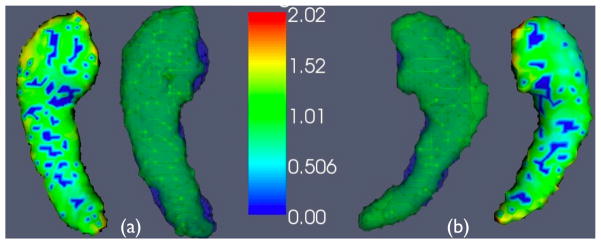
Figure 6.
The average SyGN template hippocampi are shown with (a), the healthy side mean surface distances, and (b) the diseased side mean surface distances. An individual that is near the average performance for both sides is also shown (in blue) overlaid in order to visualize the expected performance. Note the asymmetry in the expected size of the diseased versus healthy side hippocampus.

