
Figure 4.
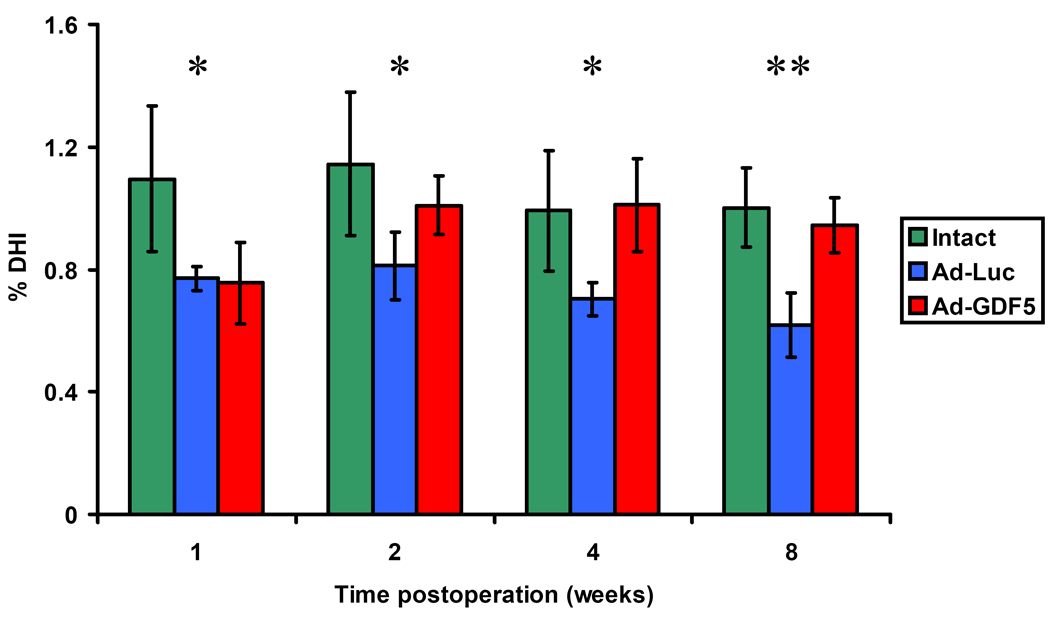
Percentage disc height index (%DHI) of intact discs, Ad-Luc injected discs and Ad-GDF5 injected discs by radiographic analysis. The data was presented as means ± SD. By “Multiple Comparisons” of one-way ANOVA Bonferroni analysis, the intact disc group showed higher mean value than either of other two groups at 1-week and Ad-Luc group showed lower means at 2-, 4-, and 8- week time points compared with either of other two groups. All of the differences reached statistic differences (p<0.05). The means of three groups at each time point were also compared by using ANOVA analysis and the p value was marked as stars in the figure. *: p<0.05; **: p<0.01