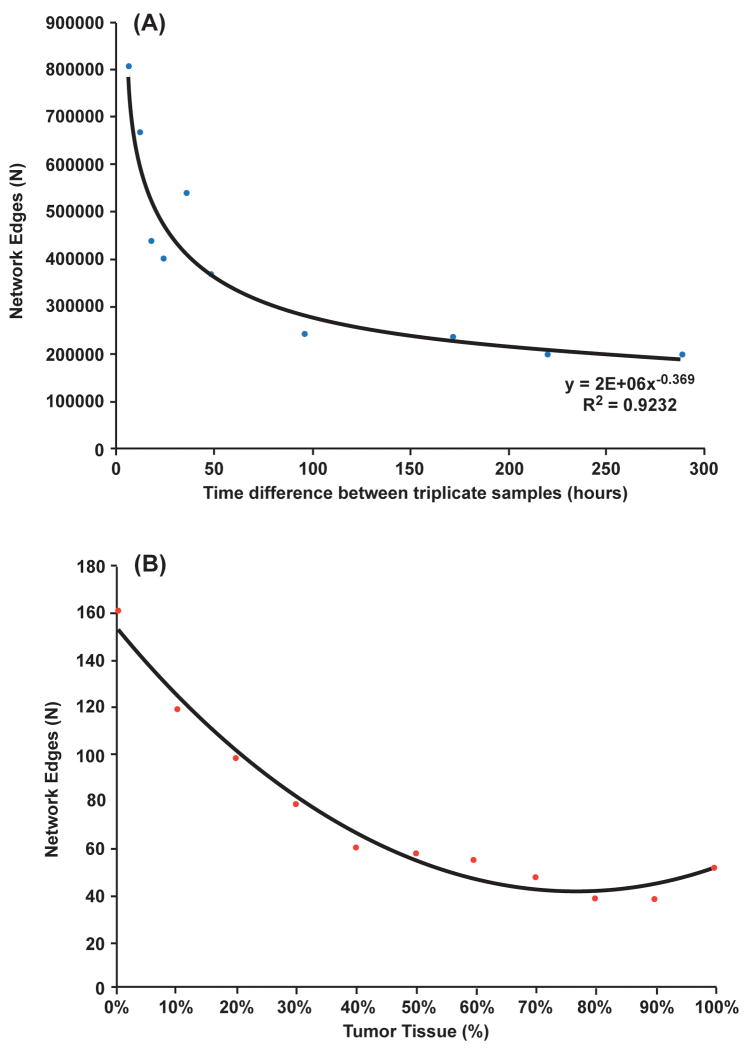
Figure 1.
Summary of Networks formed as a function of differentiative state. The number of gene pairs (network edges) formed is compared to time (hours) (A) Triplicate ES cells from time point 0 were combined into sample groups with triplicate samples from later time points and network size assessed. (B) Healthy and Tumor tissue array data. Microarrays from healthy and tumor tissues were aggregated into mixed sets with an increasing percentage of tumor tissue. The size of the network decreased when the proportion of tumor tissue increased within the mixed datasets.

