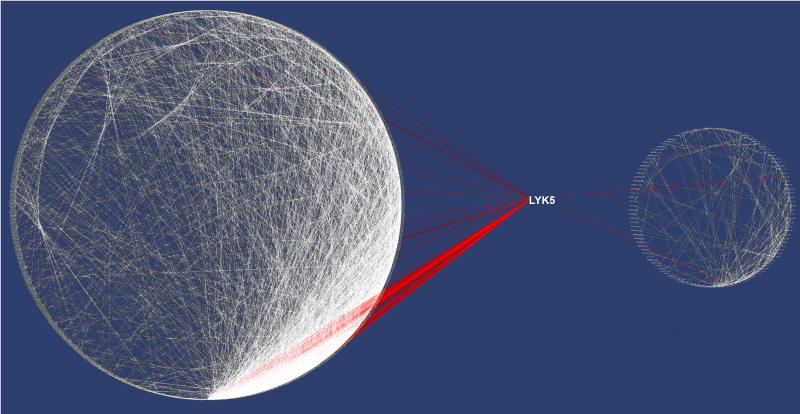
Figure 3.
Comparison of healthy tissue and tumor networks. Networks were created by cytoscape with genes arranged in a circular layout placed by their level of connectivity. Left panel, As indicated by the red lines LYK5 shows coherent expression with 118 other genes in a stable aggregate of ten healthy tumor tissue networks. Right panel, LYK5 shows coherent expression with only 2 genes as indicted by the red lines in a similar aggregate of 10 tumor tissue networks.

