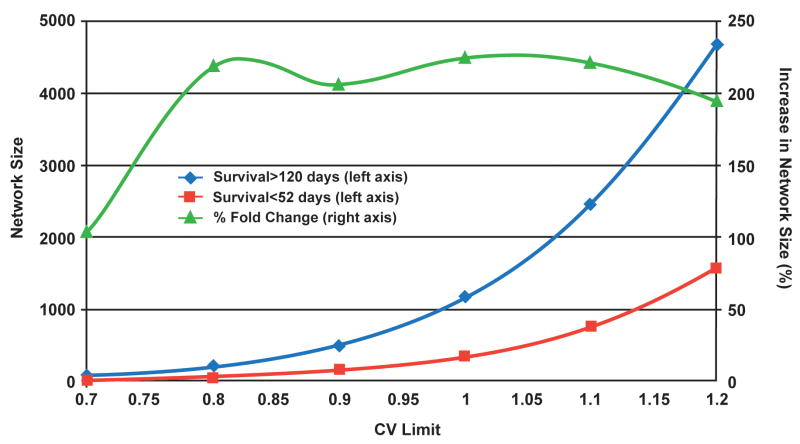
Figure 4.
Network size as a function of the maximum permitted variance between two genes (CVlimit). Tissue samples from tumors of astrocytoma patients with short (red) and long (blue) survival times were used to generate coherence networks with a range of limiting coefficients of variation. As shown by the left ordinate, the network sizes increase as a near exponential function (r=0.98) of CVlimit. The relative sizes of the short and long survival time networks remain essentially constant (green) once the networks are beyond a lower size limit. As indicated by the right ordinate, long survival:short survival plateaus at approximately 200%.

