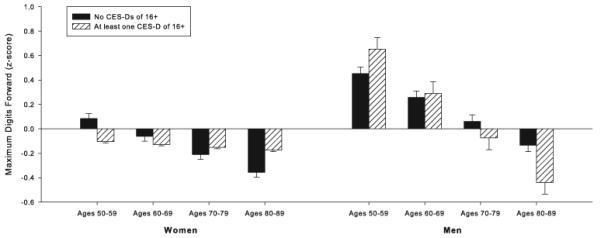
Figure 2.

Relationship between a history of elevated depressive symptoms (HDS), sex, and maximum digit span forward, the sole cognitive measure that was associated with HDS. Values represent estimated scores computed from parameter estimates of the individual mixed-effects regression equation including all main effects and significant interactions. Estimated scores were calculated as the intercept plus the sum of each predictor variable multiplied by its regression coefficient. Z-scores are based on the sample mean and standard deviation and are used only for visual display. Mean scores of individuals with no history of Center for Epidemiologic Studies Depression Scale (CES-D) scores of 16 or greater are represented by solid bars. Mean scores of individuals with at least one CES-D score of 16 or greater are represented by striped bars.
