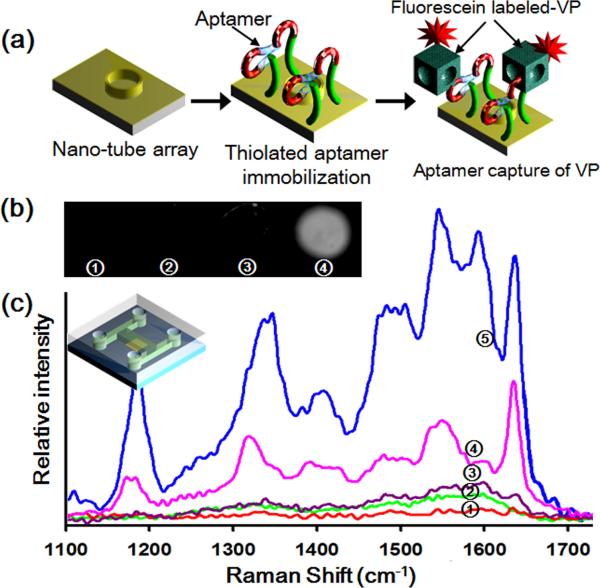
Fig. 2.
(a) Schematic of the aptamer-VP recognition binding reaction. (b) Fluorescence images of FITC-labelled aptamer-VP reaction on 200 μm patterned spots under the following conditions (1) background control sample of bare nanotube arrays, (2) after immobilization of the aptamers, (3) after aptamer-BSA reaction (negative control) and (4) after aptamer-VP reaction (positive control). (c) SERS spectra of aptamer-VP reaction corresponding to the first 3 cases described shown in image (b) and (4) for 200 nm Au nanotube arrays and (5) Au/Ag/Au nanotube arrays.

