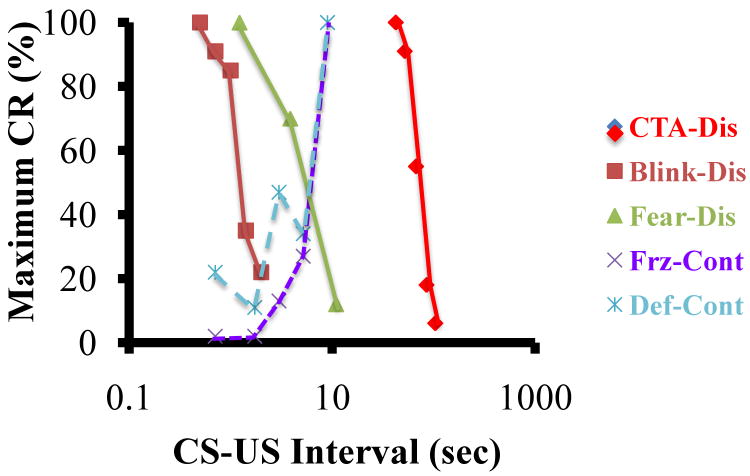
Figure 1. CS-US Interval.
The maximum possible Conditional Rresponse (CR) is plotted for three types of conditioning with discrete trials (conditioned taste aversion in rats—CTA-Dis [8], eyeblink conditioning in rabbits—Blink-Dis [9], and fear conditioning in rats—Fear-Dis [10]) using solid lines. Dashed lines present two measures of context fear: freezing—Frz-Cont [11] and defecation—Def-Cont [11]. Because of the tremendous range of CS-US intervals between eyeblink and taste aversion learning, the abscissa plots the square root of the number of seconds between CS and US onset on a log scale. Note that the time range for discrete and contextual fear conditioning overlaps but the direction of the functions is opposite.

