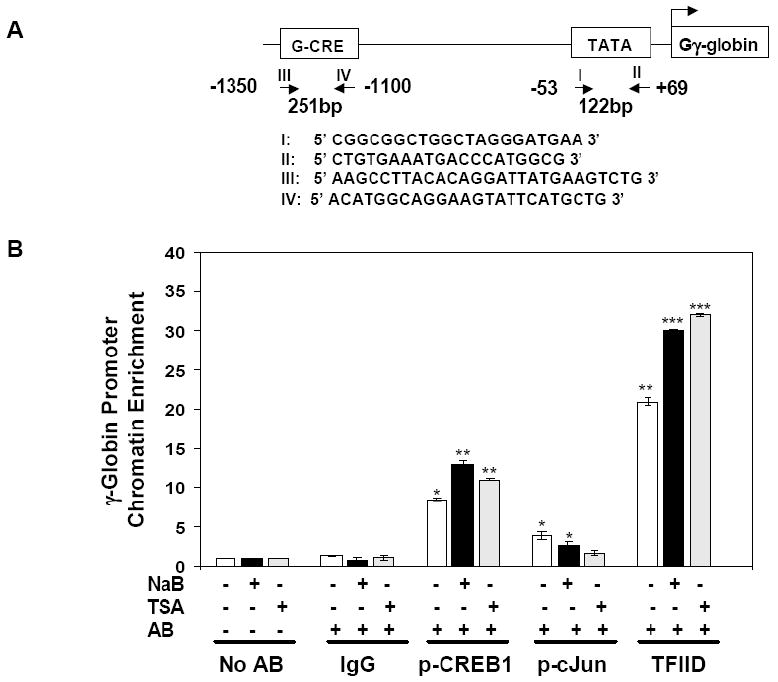
Fig. 1. cJun and CREB1 bind G-CRE region in vivo.

ChIP assays were performed in K562 cells to determine cJun and CREB1 binding to the Gγ-globin CRE (G-CRE) region in vivo. A) Two sets of primers shown in the diagram were used for quantitative PCR (qPCR) to verify chromatin enrichment in the Gγ-globin promoter. Primers I and II target the -53 to +69 region to confirm TFIID binding to the TATA box while primers III and IV were used to measure chromatin enrichment in the G-CRE region. B) ChIP assay quantitative results for untreated K562 cells (-) or after treatment with 2 mM NaB or 0.5 μM TSA (+) are shown in the graph. Data from qPCR analysis was plotted as fold change in chromatin enrichment for the immunoprecipitation reactions performed with the antibodies shown. The no antibody (No AB) and IgG samples were used as controls. Chromatin enrichment levels for No AB samples were normalized to one. Data are shown as the mean ± standard error of the mean (SEM), *p<0.05 was considered significant (**p<0.01 and ***p<0.001).
