
Fig. 2. cJun and CREB1 phosphorylation levels increase after drug treatment.
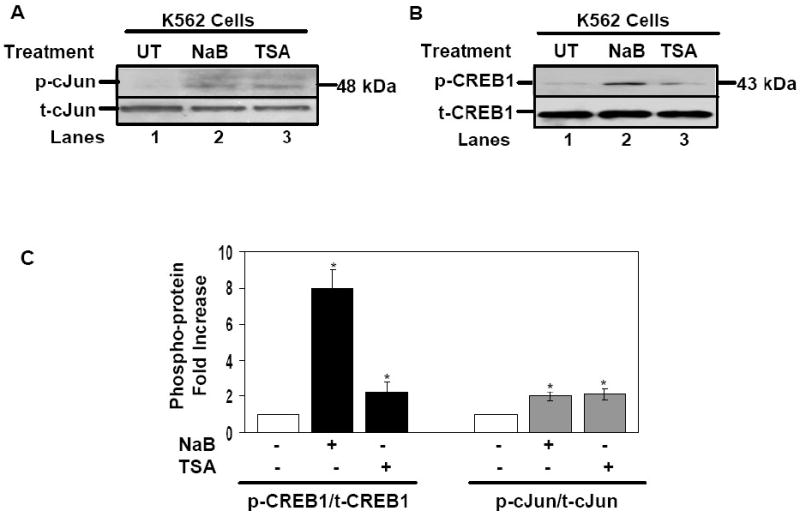
Protein extracts were isolated from K562 cells treated with NaB (2 mM) or TSA (0.5 μM) for 48 hrs (see Materials). A) Shown is the western blot performed with phosphorylated-cJun (p-cJun) and total-cJun (t-cJun) antibody. B) Western blot analysis results for p-CREB1 and t-CREB1 antibody is shown. C) Quantitative data obtained from the western blot gels using ChemiDoc software (Biorad) are shown in the graphs. Shown are p-CREB1/t-CREB1 (black bars) and p-cJun/t-cJun (gray bars) protein levels in the absence (-) or presence (+) of drug treatments. Data are shown as the mean ± SEM, *p<0.05 was considered significant.