
Figure 1. Laterality Index Magnitude Changes as a Function of Pathway Anisotropy.
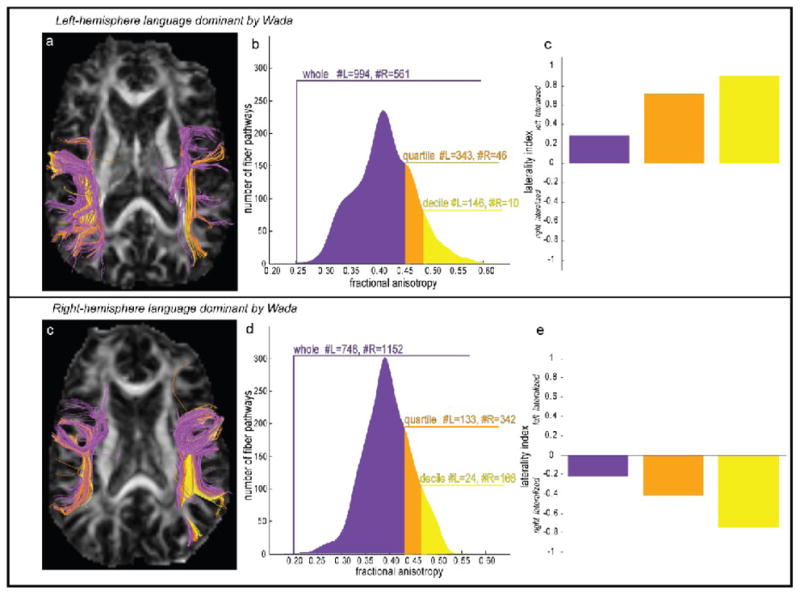
Individual tractography pathways are colored for a left Wada patient (a) and a right Wada patient (b) according to whether the average fractional anisotropy (FA) of intersected voxels was in the upper decile (yellow), quartile (orange), or whole (purple) portion of the entire pathway FA distribution. Separate laterality indices (c,e) were computed as the ratio (L−R/L+R) of the number of left and right hemisphere pathways in the whole, quartile, and decile of each patient’s pathway FA distribution (b,d).