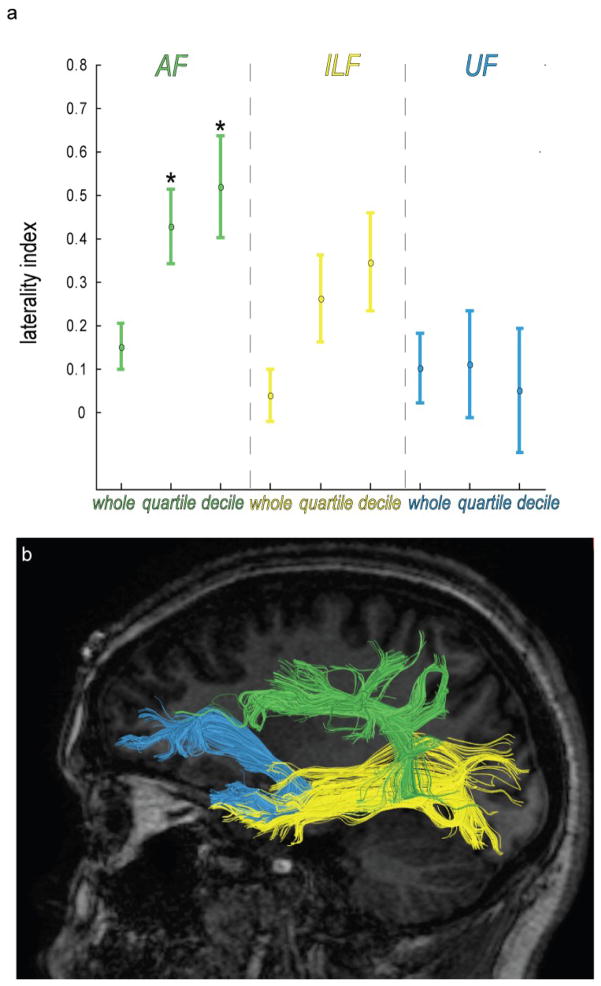
Figure 2. High Anisotropy Arcuate Fasciculus Pathway Density is Asymmetric.
(a) Laterality indices computed from the upper quartile and decile of the arcuate fasciculus (AF) pathway FA distribution are significantly different from zero (* two-tailed t-test corrected for multiple comparisons) for the dominant hemisphere as determined by Wada testing, but are not significantly different for the inferior longitudinal fasciculus (ILF) or uncinate fasciculus (UF). (b) A sample from one patient showing the arcuate (green), uncinate (blue), and inferior longitudinal (yellow) fasciculus. Each of these three tracts has at least one large group of terminations in the temporal lobe with the UF and ILF terminating in anterior temporal lobe and AF terminating more posterior.

