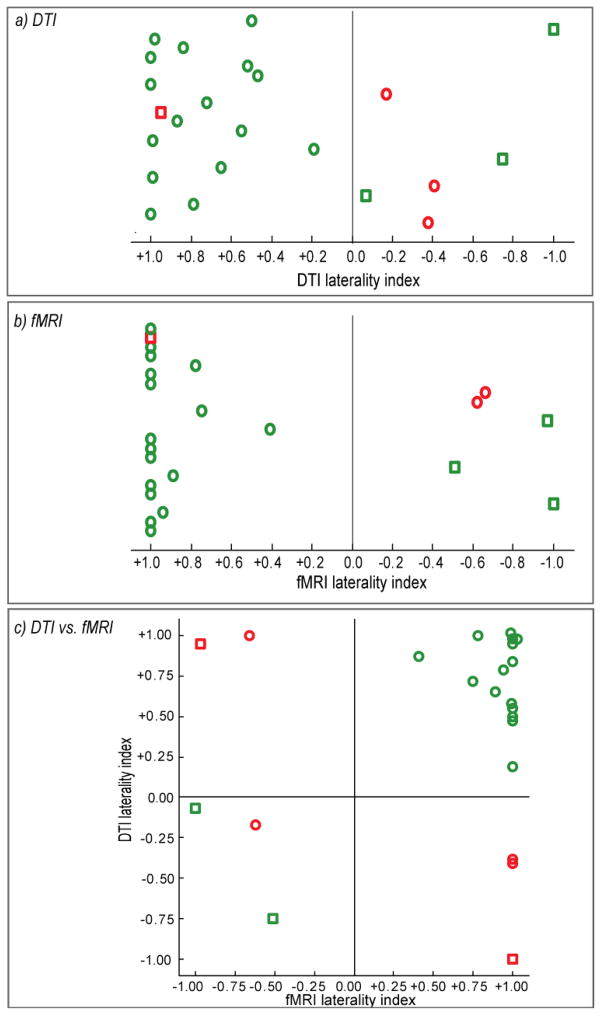
Figure 3. Agreement of Structural and Functional Laterality Estimates with Wada Outcome.
(a) DTI laterality indices determined by asymmetry of the highest decile AF pathways are shown, as well as (b) fMRI laterality indices determined from asymmetry in Broca’s area suprathreshold activation. Left hemisphere Wada patients are represented by circles, and right hemisphere Wada patients are represented by squares. Circles and squares are colored green if laterality indices classify the dominant hemisphere according to Wada outcome, and red if classification is opposite to Wada outcome. (c) Each patient’s DTI laterality index is plotted against their fMRI laterality index. If all patients were classified perfectly according to both structure and function, all squares (right Wada) would cluster in the lower left quadrant, and all circles (left Wada) would cluster in the upper right quadrant.

