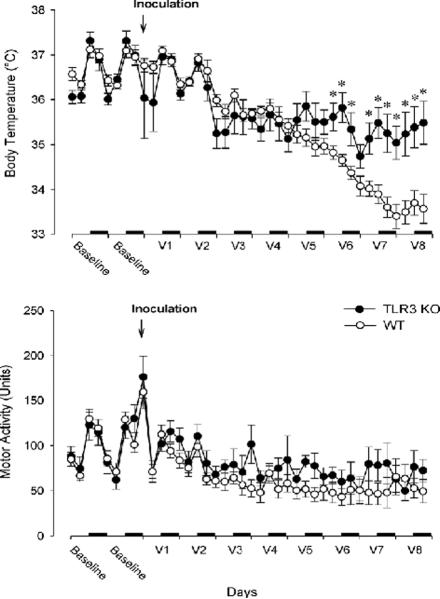
Fig. 1.
Body temperature (top panel) and locomotor activity (bottom panel) of WT (white circles, n = 15) and TLR3 KO (black circles, n = 8) 48 h prior to infection and for 8 days following virus inoculation (V1 – V8). Horizontal dark bars: dark phase of the day. Asterisks: significant difference between the two genotypes (Student's t-test, p < 0.005). Data are expressed as 6-h averages (± SE).

