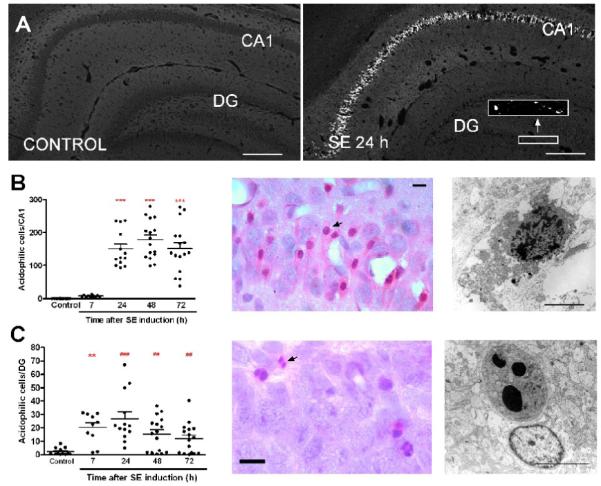
Figure 1. SE induces necrosis in CA1 and apoptosis in DG.

(A) Images of Fluoro-jade B staining in hippocampus from control animal and 24 h following SE. (B-C) Time course of neuronal injury in CA1 (B) and DG (C) following SE. Left panels: The graphs represent the number of eosinophilic cells detected with H&E staining from CA1 (B) and DG (C) 7–72 h after SE. Analyzed by Dunn’s test (***p<0.001, **p<0.01 vs control) or Mann Whitney test (###p<0.001, ##p<0.01 vs control). Middle panels: High magnification images of eosinophilic cells with pyknotic nuclei from CA1 (B) and fragmented nuclei from DG (C) obtained 24 h after SE. Arrows point to injured neurons. Right panels: Electron microscopy micrographs obtained 24 h after SE, showing a CA1 necrotic cell, characterized by swollen organelles, ruptured plasma membrane and tigroid fragmentation of the chromatin (B) and a DG cell with a late stage of apoptosis, characterized by large round chromatin clumps and mild organelle swelling (C). Scale bars in A = 100 μm; B-C = 25 μm (light microscopy) and 3 μm (electron microscopy).
