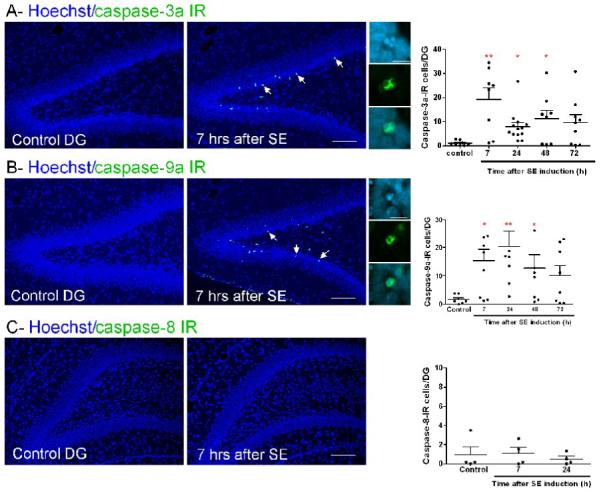
Figure 4. SE activates the intrinsic pathway in morphologically apoptotic DG neurons.

(A-B) Images of caspase-3a or −9a IR (green) and Hoechst staining (chromatin dye, blue). Arrows point to IR cells in DG 7 h following SE. High magnification images show that IR is observed mainly in the cytosol of cells with fragmented nuclei. The graphs represent the number of IR cells in DG 7–72 h after SE (**p<0.001, *p<0.05 vs control). (C) Images showing the absence of caspase-8 IR in DG. The graph represents the number of caspase-8-IR cells in DG 7–24 h after SE. Scale bars = 100 μm (low magnification images) and 25 μm (high magnification images).
