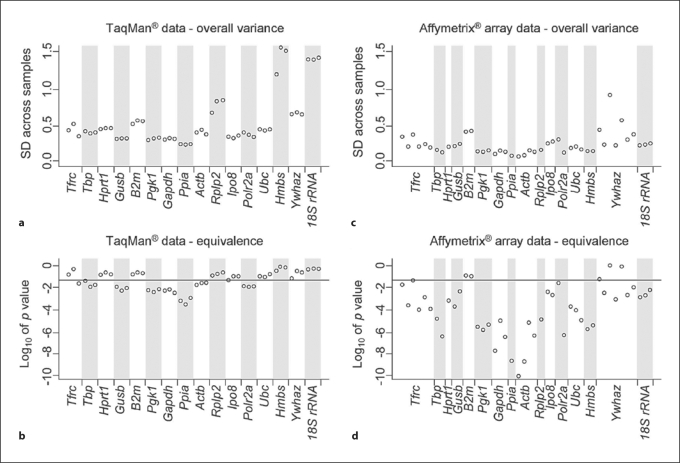
Fig. 2.
Gene expression stability of commonly used endogenous RT-PCR controls. Gene expression stability based on TaqMan® RT-PCR data (a, b) and Affymetrix GeneChip® data (c, d) was evaluated with the method of ‘total variance’ that is expressed as the standard deviation (SD) across all samples (a, c) and the TOST method that measures gene expression equivalence across all samples (b, d). For the TaqMan® analyses (a, b), each point represents data from a single technical replicate from all studied kidneys (3 replicates per gene). For the GeneChip® analyses (c, d), each point designates data from all studied kidneys corresponding to one of the multiple probe sets that represent a specific gene on the GeneChip® array. The horizontal line in the lower panels represents gene-specific p values (0.05) for a 1.5-fold equivalence threshold. Genes with favorable endogenous control profiles have consistently low overall variance and high significance of equivalence (e.g. Ppia, Gapdh and Pgk1), unlike controls with less suitable expression (e.g. B2m and Ywhaz).

