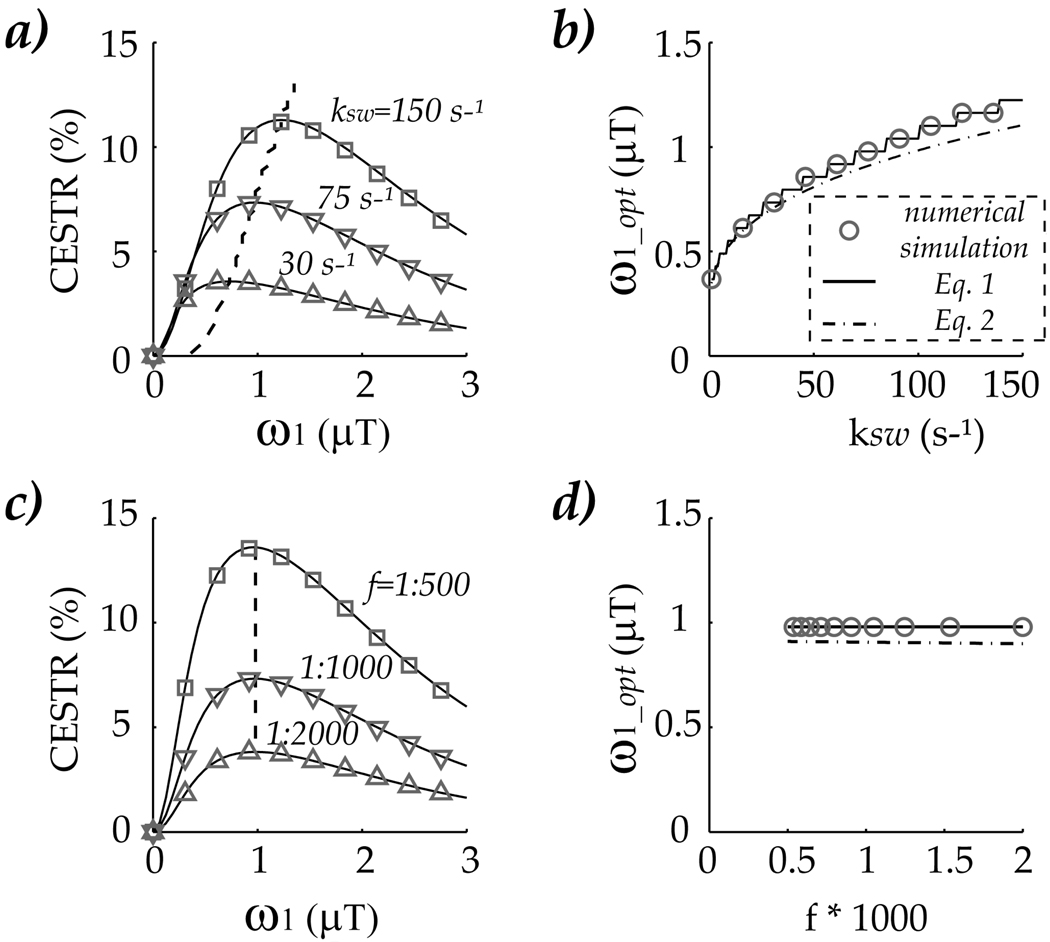
Fig. 2.
a) CEST MRI contrast was simulated as a function RF power for three exchange rates, 30, 75 and 150 s−1 at a labile proton content of 1:1000. The up triangle, down triangle and square markers denote numerical simulation, while the line represent empirical solution results using Eq. 1, which agreed well. The optimal RF power for each exchange rate is shown in dashed line, b) The Optimal RF power was plotted as a function of exchange rate, with circles, sold line and dashed line represent numerically simulated results, analytical estimates from Eq. 1 and Eq. 2, respectively. In addition, CEST MRI was also simulated for labile proton concentration effect, in which concentration was varied from 1:2000 (up triangle), 1:1000(down triangle) to 1:500 (square) for a representative exchange rate of 75 s−1 in (c), with the optimal RF power shown in the dashed line, d) The optimal RF power estimated from empirical solution of Eq. 1 and Eq. 2 agrees well with the numerical simulation (circle).

