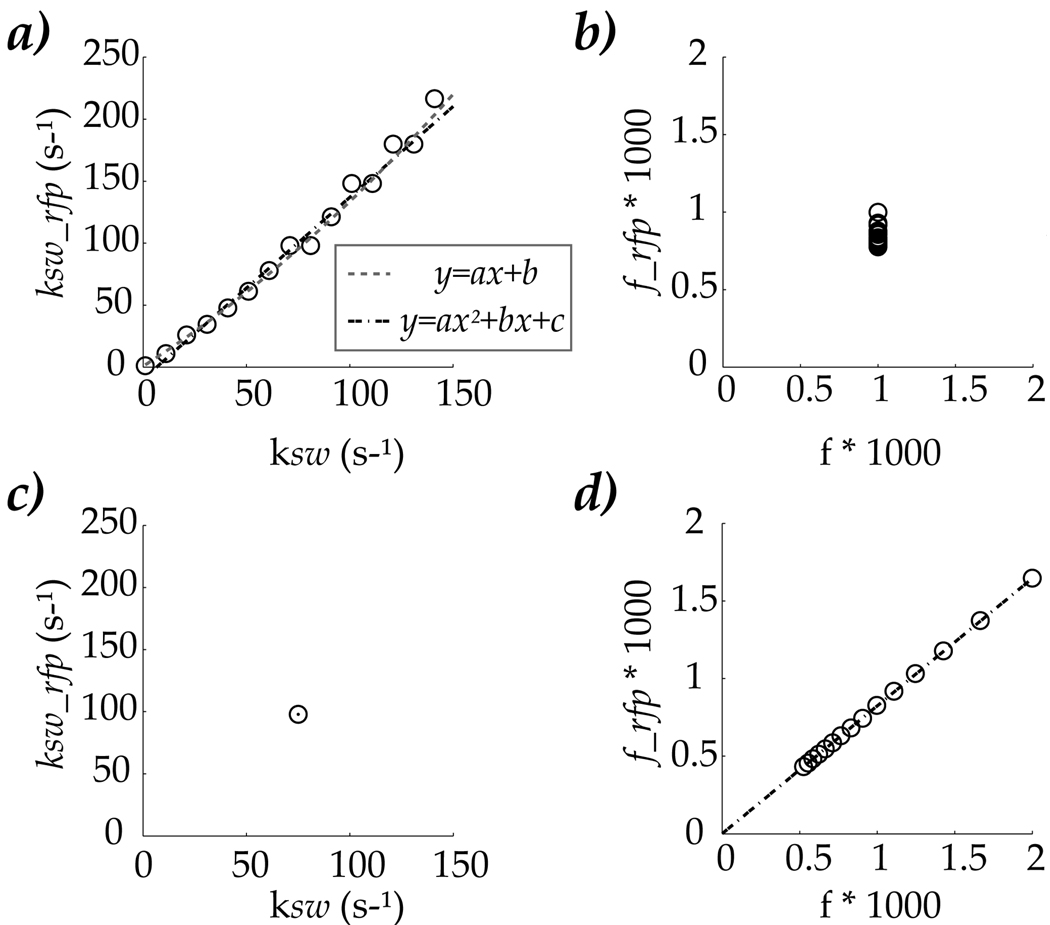
Fig. 5.
Evaluation of the inverse problem that whether exchange rate and labile proton concentration effect can be simultaneously determined from the optimal RF power. For the first case, exchange rate was varied between 1 and 150 s−1, while the labile proton concentration was 1:1000. The estimated exchange rate correlated well with simulated values (a), and can be described by a linear function. In addition, the derived labile proton concentration had a narrow distribution from the simulated value of 1:1000 (b). For the second case, labile proton concentration was varied from 1:2000 to 1:500, for a representative exchange rate of 75 s−1. The exchange rate was found to be 98 s−1 from Eq. 2, in contrast to simulated value of 75 s−1(c). Moreover, the estimated labile proton concentration vs. simulated value can be described by a linear function.

