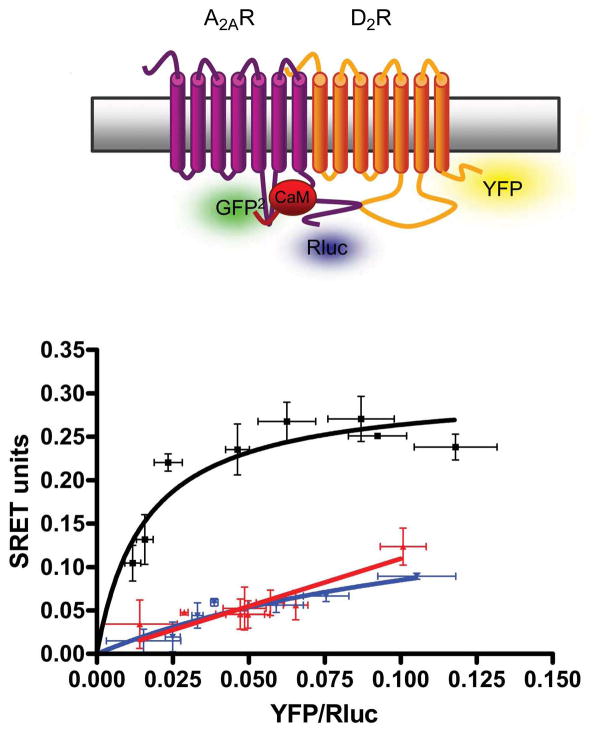
Figure 1. SRET for CaM, A2A receptor and D2 receptor in living cells.
SRET saturation curves performed in HEK-293 cells expressing A2A-Rluc (0.75 μg of cDNA), CaMGFP2 (0.6 μg of cDNA) and increasing amounts of D2YFP (0.5 to 5 μg of the cDNA). Net SRET was obtained by monitoring the YFP fluorescence emission after DeepBlueC addition, with subtraction of the value obtained with cells expressing the same amount of A2A-Rluc and CaMGFP2. Significant net SRET was detected for A2ARluc-CaMGFP2-D2YFP coupling, while negligible or linear net SRET was obtained in cells expressing equivalent amounts (equivalent fluorescence and luminescence units) of A2ARluc, CaMGFP2 and 5HT2BYFP (red curve), or A1RRluc, CaMGFP2 and D2RYFP (blue curve) as negative controls. Values, expressed as net SRET, represent means ± S.E.M. of 5 independent experiments performed in triplicate. At the top, scheme depicting the expressed proteins in the SRET assay (modified from ref. [14•]).

