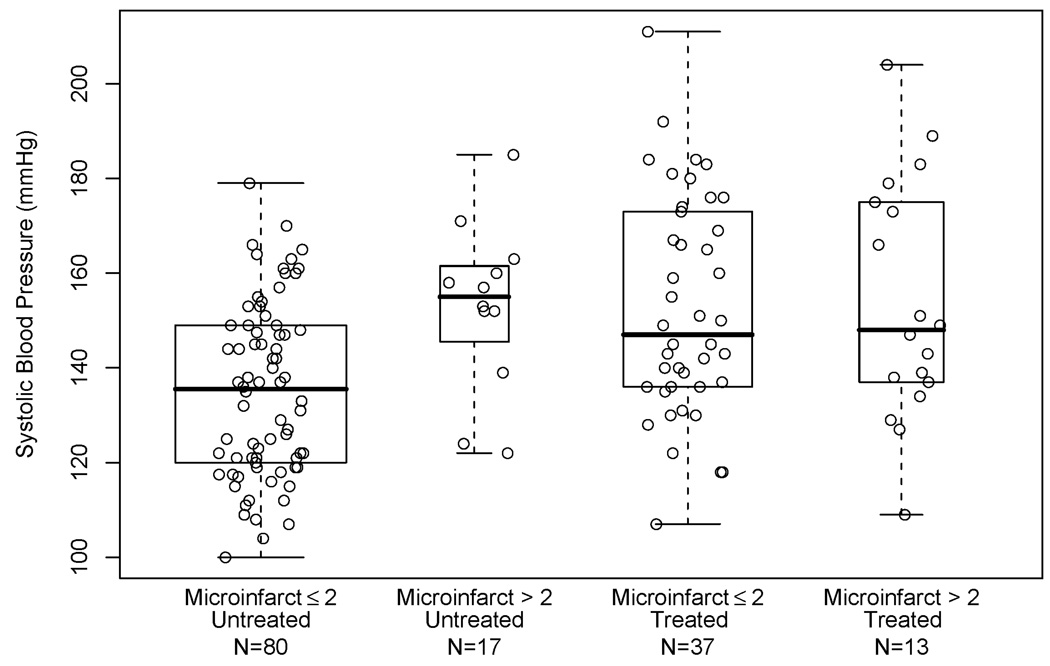
Figure 2.
Box plots of systolic blood pressure entry in participants aged 65–80 years, by presence of > 2 microinfarcts and by antihypertensive treatment at study entry. Boxes represent 50% of the data with horizontal bar denoting the median. Data points outside the “whiskers” are considered outliers. A scatterplot of systolic blood pressure by jittered treatment/pathology category is overlaid.

