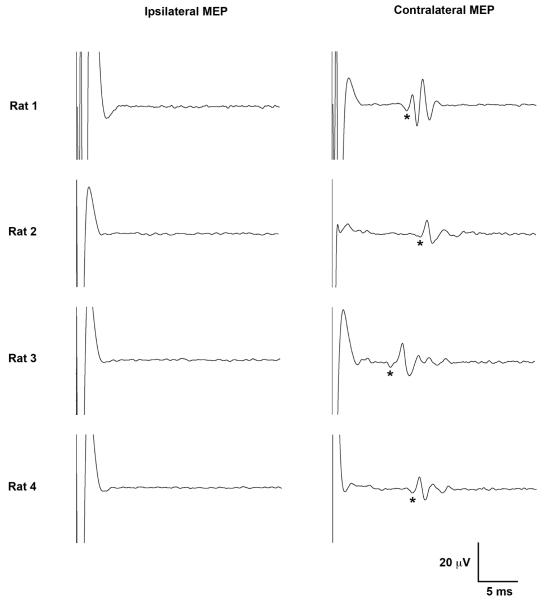
Figure 2. Representative Motor Evoked Potential (MEPs).
Lateralized ipsilateral (left) and contralateral (right) MEPs recorded from the brachioradialis in four rats are shown. Each tracing is an average of five MEPs at 100% MT. Latency to the start of the first positive deflection (*) was used to calculate timing of MEP onset. Note, the polyphasic appearance of the MEP signal required rectification to absolute values for statistical integration of voltages. Upward trace deflections correspond to negative voltage.

