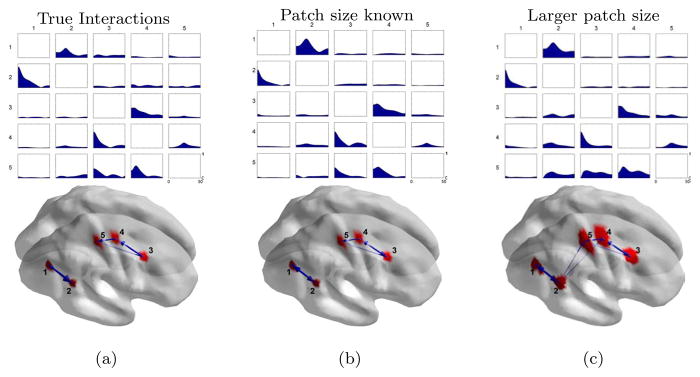
Figure 9.
Top: PDC interaction measures computed using (a) the true LPF signal, and reconstructed time series using the nulling beamformer with (b) known patch sizes and (c) enlarged patch sizes. Bottom: significant PDC interactions at an α = 5% significance level after correcting for multiple comparisons using a permutation test.

