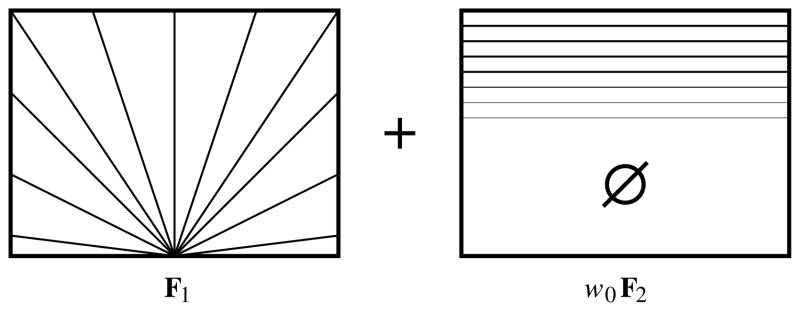
Fig. 10.
A schematic illustration of the geometry of synthetic fields F1 and F2, which are combined according to (6) in order to produce a field of synthetic crossing tensors. F2 is illustrated after multiplication by weighting function ω0, which results in a band in the upper part of the dataset with a smooth edge with a sigmoid profile.

