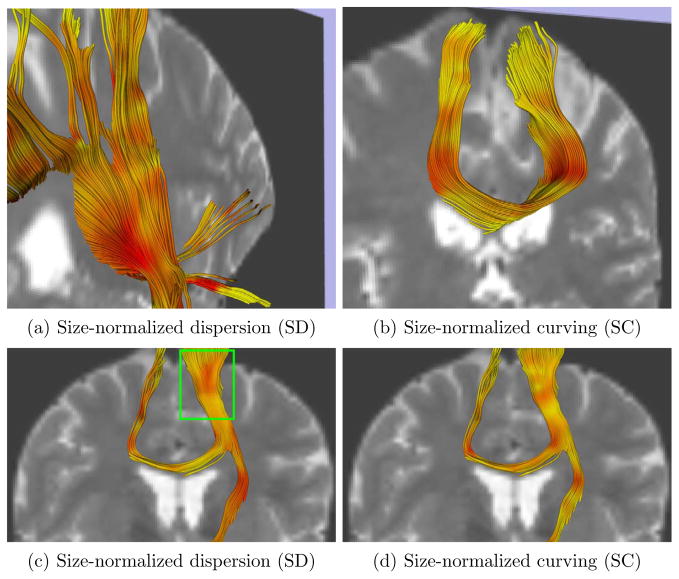
Fig. 6.
Streamline DT tractography colored by SD index (a,c) and SC index (b,d). Red indicates high index values. The T2-weighted image is shown in the background for reference. The region in the green box is discussed further in the text. (a) and (b) are displayed from an oblique angle for a better viewing of the tract geometry.

