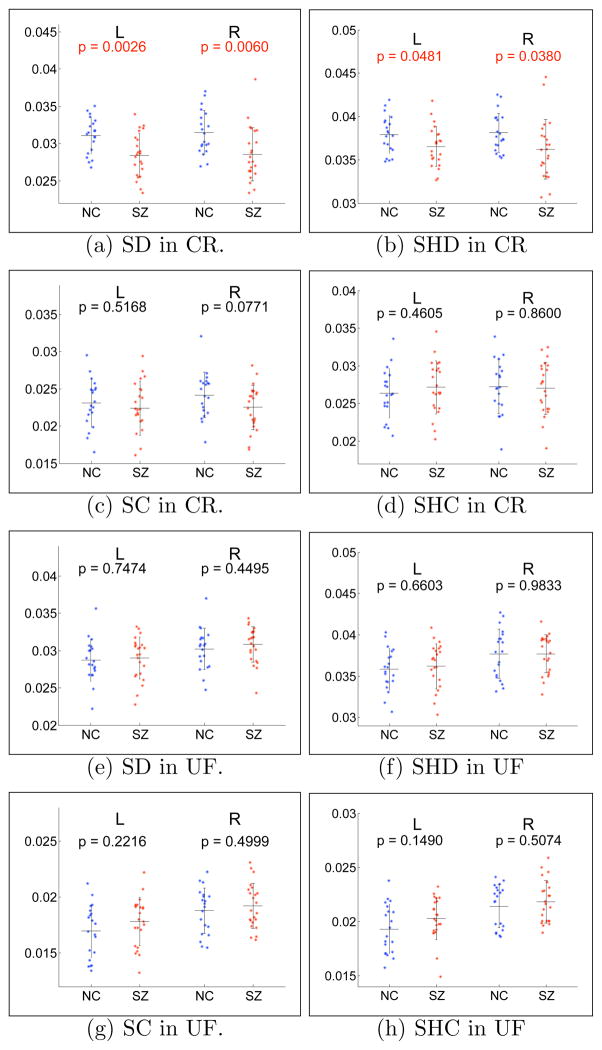
Fig. 9.
Scatter plots of mean index value for the anterior part of the corona radiata (CR) and for the uncinate fasciculus (UF). Left column: size-normalized indices. Right column: shape-normalized indices. Blue: NC. Red: SZ. Horizontal black lines: population mean. The error bars indicate ± 1 standard deviation. L: left hemisphere. R: right hemisphere. The p-values are computed with a two-sample T-test, and those that satisfy a significance threshold of 0.05 are given in red font.

