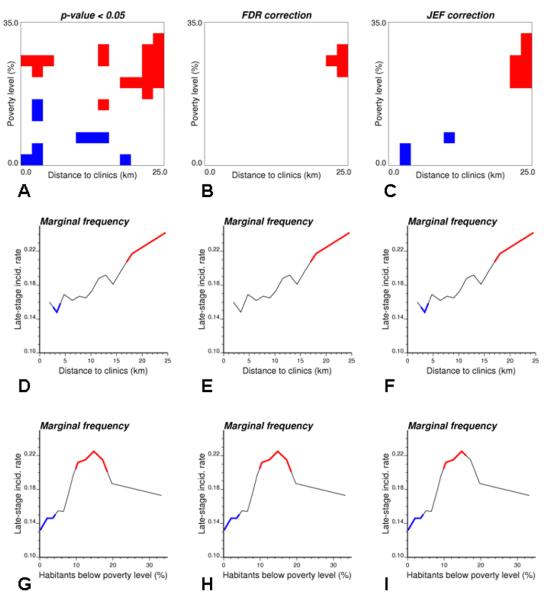
Fig. 5.
Impact of multiple testing correction on the significance of joint and marginal frequencies computed in Figure 2: No correction (1st column), False discovery rate (FDR) correction (2nd column), and simulation-based procedure (3rd column). In all graphs, blue (red) pixels and segments represent incidence rates that are significantly lower (higher) than the incidence rate expected under the assumption of no impact of covariates on late-stage diagnosis (α=0.05).

