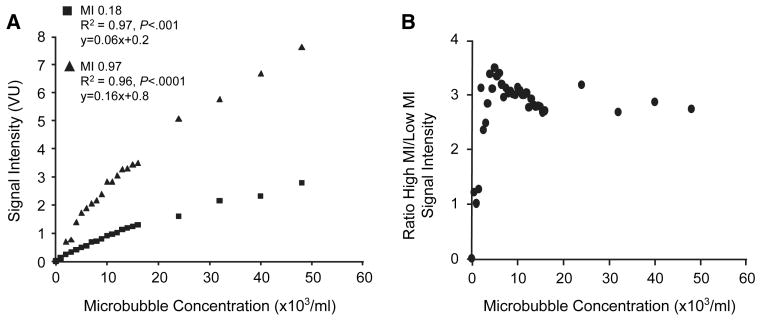
Figure 1.
Imaging data from in vitro water tank experiments after log-linear transformation. (A) Relation between microbubble concentration signal enhancement at low- and high-MI. VU, videointensity units. (B) Ratio of high-MI to low-MI signal enhancement over the range of microbubble concentrations studied.

