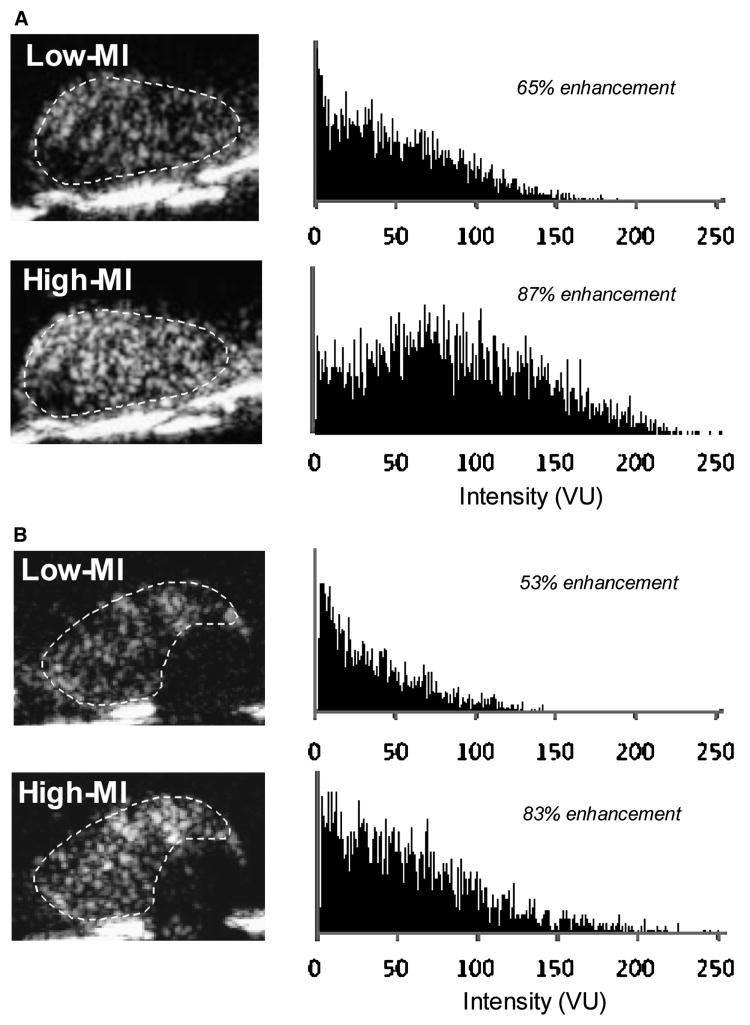
Figure 6.
Representative examples from two separate animals (A and B) of log-compressed images obtained with P-selectin-targeted microbubbles imaged at low-MI and high-MI settings, and corresponding histograms of pixel intensity on a 256 gray-scale range from a region-of-interest (dashed line) placed around the adductor muscle group. The percent enhancement values represent the fraction of pixels within the region-of-interest that demonstrate enhancement according to the pixel intensity threshold analysis. VU, videointensity units.

