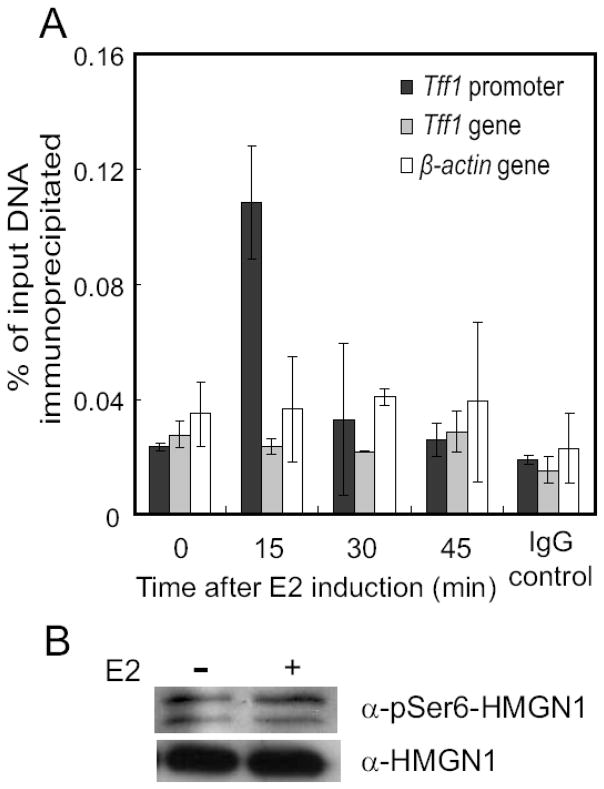
Figure 1. Rapid and transient association of pSer6HMGN1 with the TFF1 promoter upon estrogen induction.
MCF-7 cells were cultured under estrogen-deprived conditions and then treated with 100 nM 17-β-estradiol (E2) for the indicated times. (A) ChIP using antibodies against pSer6HMGN1. Input DNA and immunoprecipitated DNA were quantified by real time PCR using the primers described previously [26]. The amount of binding of protein to a specific promoter or gene region is expressed as percentage of DNA immunoprecipitated by either the specific antibody or IgG (right most set of bars), as compared to the total chromosomal DNA before immunoprecipitation. Error bars represent standard deviation from two independent experiments. (B) Immunoblotting from a representative experiment, showing the levels of total cellular pSer6HMGN1 and HMGN1 with and without estrogen treatment.

