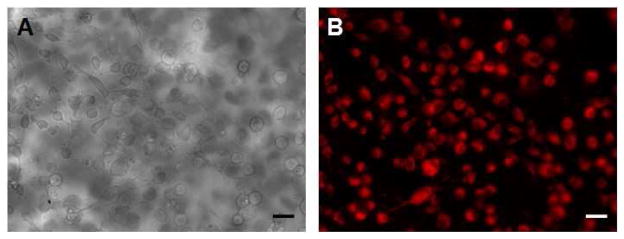
Figure 4.
Cellular uptake studies using a monkey kidney fibroblast (Vero) cell line. (A) A phase contrast micrograph and (B) the corresponding fluorescence image of Vero cells incubated for 24 h with 8.0 μg mL−1 [HMT][AOT] nanoGUMBOS. The fluorescence was collected using a propidium iodide (PI) filter set: λex = 540 nm; λem = 617 nm long pass. Scale bars in (A) and (B) are 10 μm.

