
Figure 1.
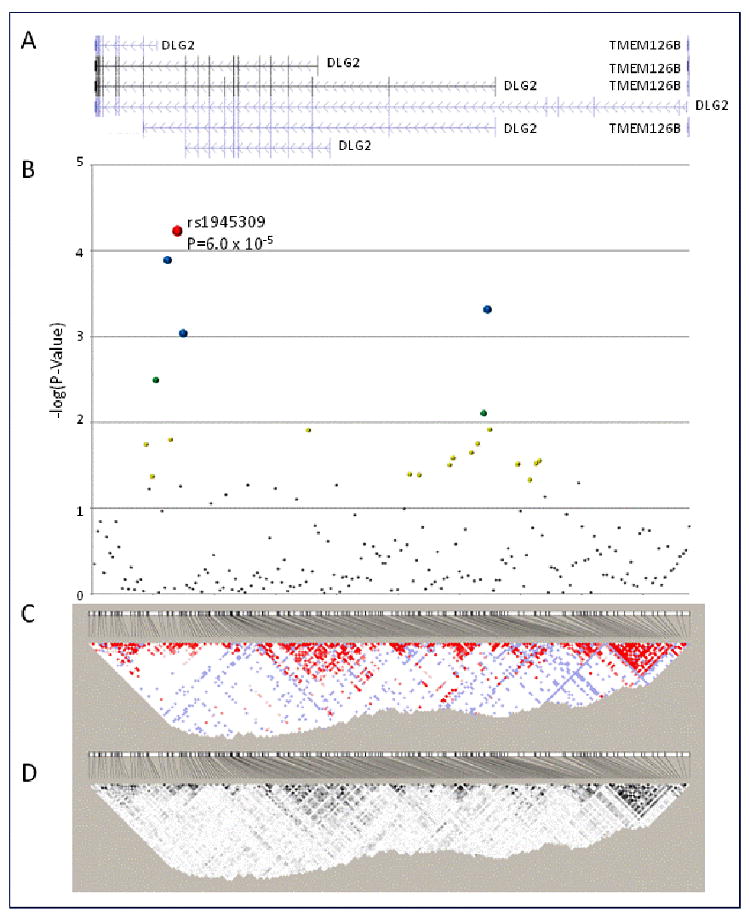
Association analysis and linkage disequilibrium structure of 193 SNPs genotyped across the DLG2 locus (NCBI Build 36.1 hg 18 chr11: 82844368-85006039). A. annotated transcripts across the DLG2 locus (NCBI Build 36.1 hg 18 chr11: 82844368-85006039). B. Association analysis of 195 DLG2 SNPs with disposition index (DI) in the combined African American population from the IRAS-FS. 2df association P-values are presented as the –log(P-Value) for SNPs along a condensed, equidistant x-axis. C and D. Haploview-generated LD map of the 27 SNPs at the DLG2 locus in unrelated African Americans (n=58) from the IRAS-FS. The number within each box indicates the D' and r2 statistic value between the corresponding two SNPs in panels C and D, respectively.