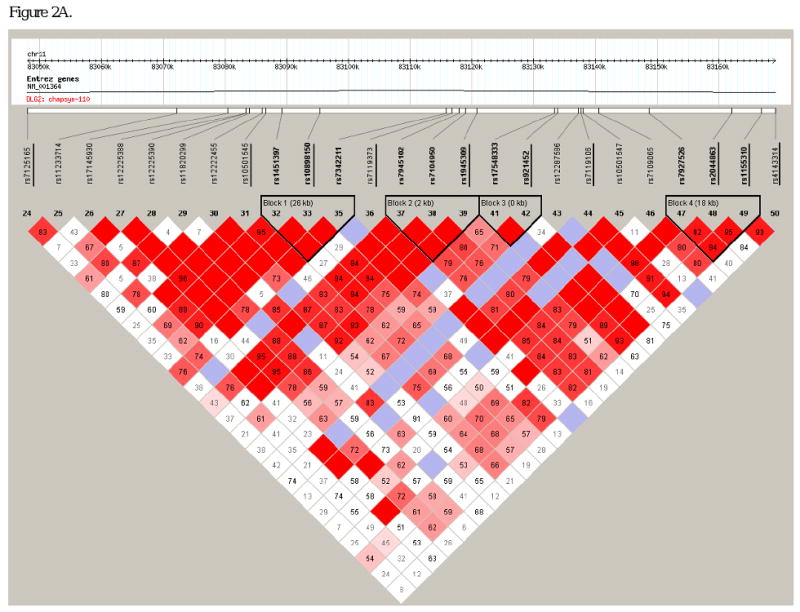
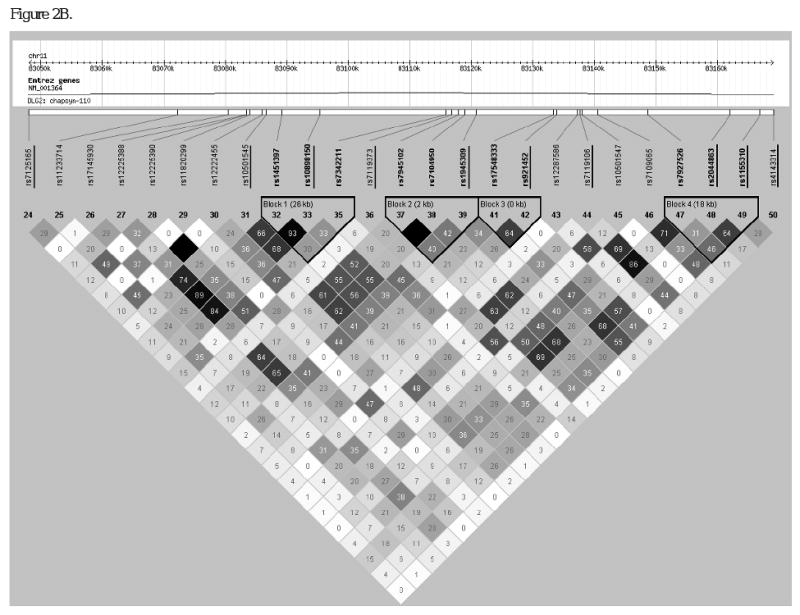
Figure 2.


Linkage disequilibrium structure within intron 13 of DLG2. Haploview-generated LD map of the 27 SNPs at the DLG2 locus in unrelated African Americans (n=58) from the IRAS-FS. The number within each box indicates the D' and r2 statistic value in panels A and B, respectively. SNPs from the initial analysis of 193 SNPs (underlined) are intercalated with SNPs from the follow-up analysis.
