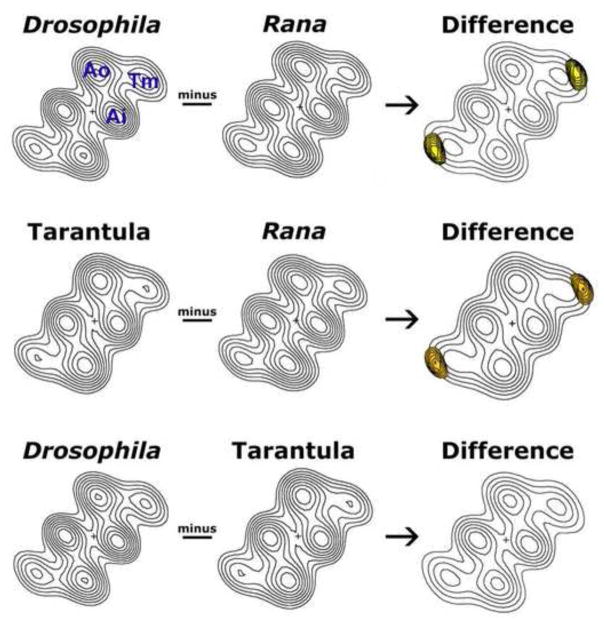
Figure 2.
Difference density analysis of 3D reconstructions of native thin filaments from Drosophila melanogaster IFM, tarantula femur muscle and Rana pipiens sartorius muscle. Helical projections were calculated from the 3D reconstructions of the thin filaments. The maps show axially averaged positions and dimensions of actin and tropomyosin densities. Ao = outer domain of actin, Ai = inner domain of actin, Tm = tropomyosin. In the absence of Ca2+, tropomyosin strands clearly contact the outer domain of actin. These projections are well suited for aligning and comparing the average densities along thin filament lengths, from different species. Subtraction of the densities of the Rana map from either Drosophila or tarantula maps reveals the presence of difference peaks (yellow) within the tropomyosin strands. These peaks are shown superimposed on the Drosophila or tarantula helical projections (displayed with limited contours for clarity). The differences are significant at greater than the 95% confidence level. No significant differences were detected between the Drosophila and tarantula tropomyosin strands.

