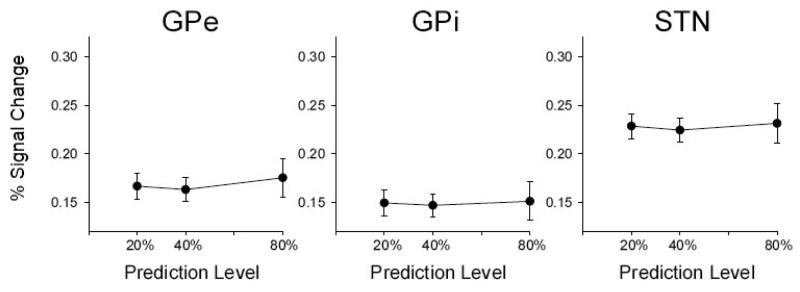
Figure 5.
Posterior basal ganglia activation across prediction level. Displays the results from the ROI analysis with percent signal change as the dependent measure. These subcortical areas of the basal ganglia did not change in signal intensity across the grip prediction level. External globus pallidus (GPe), internal globus pallidus (GPi), and subthalamic nucleus (STN) are shown. The standard error of the mean is shown at each prediction level.

