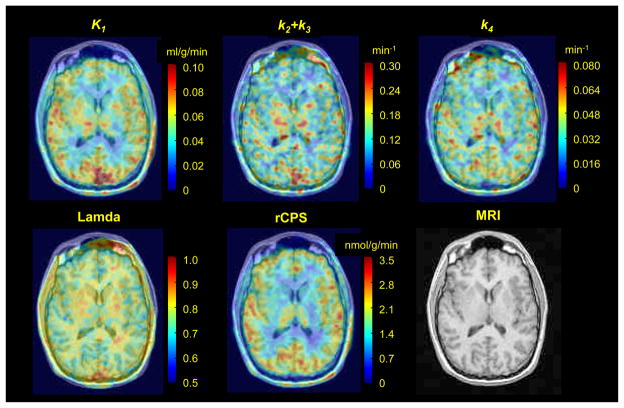
Fig 3.
Parametric maps of K1, k2+k3, k4, λ, and rCPS obtained with the basis function method for one transverse image plane from a L-[1-11C]leucine PET study of an awake 23 year old male subject. A Gaussian filter (FWHM 3.9 mm) was employed to smooth each of the parametric images in three dimensions before visualization. The same image plane of the co-registered MRI is shown in the bottom right.

