
Table 1.
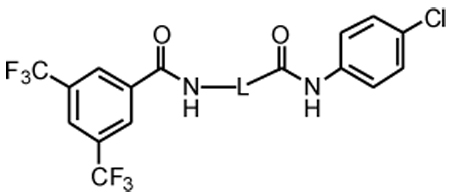
Effects of tether length and composition on transcription and cytotoxicity in transfected PC-3 cellsa
 | |||||
|---|---|---|---|---|---|
| Cmpd | L | IC50 SRE.Lb (µ M) |
% inh SRE.Lb (10, 100 µM) |
% inh pRL-TKc (10, 100 µM) |
% inh WST-1d (10, 100 µM) |
| 1 | -OCH(CH3)- | 1.5 | 74, ND | 48, ND | 44, ND |
| 5a | -OCH2- | 4.7 | 71, 100 | 53, 89 | 42, 91 |
| 4a | -CH2CH2- | 38 | 38, 64 | 0, 22 | 0, 10 |
| 4b | -CH2- | 33 | 45, 85 | 15, 25 | 0, 30 |
| 4c | -CH2CH2CH2- | 21 | 37, 79 | 5, 42 | 0, 12 |
| 4d | -CH2CH2CH2CH2- | >100 | |||
a
For assay descriptions, see Ref 20. All values are mean of ≥ 3 experiments, each run in triplicate.
b
Inhibition of Rho-pathway selective serum response element-luciferase reporter.
c
Inhibition of control pRL-thymidine kinase Renilla luciferase reporter.
d
Inhibition of mitochondrial metabolism of WST-1.