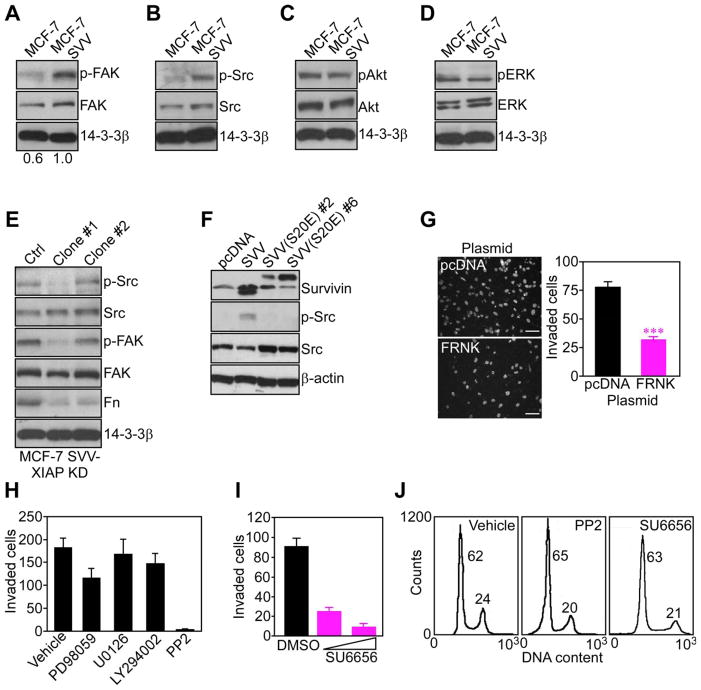
Figure 5. IAP activation of cell motility kinases.
(A-D) Adherent cells were analyzed after 48 h by Western blotting for phosphorylation/expression of FAK (A), Src (B), Akt (C), or ERK1,2 (D). (E) MCF-7 SVV cells with stable shRNA knockdown of XIAP (MCF-7 SVV-XIAP KD; clones #1 and #2) were analyzed by Western blotting. (F) INS-1 cells stably transfected with wild type survivin (SVV) or survivin S20E mutant (clones #2 and #6) were analyzed by Western blotting. (G) MCF-7 SVV cells transfected with pcDNA or FAK dominant negative FRNK mutant were analyzed for Matrigel invasion after 6 h by DAPI staining (left), and quantified (right). Scale bars, 200 μm. ***, p<0.0001. (H) MCF-7 SVV cells treated with the indicated pharmacologic inhibitors were quantified for Matrigel invasion after 6 h. (I) MCF-7 SVV cells treated with the Src inhibitor SU6656 (25–50 μM) were quantified for Matrigel invasion after 6 h. (J) MCF-7 SVV cells were incubated with vehicle (DMSO) or the indicated Src inhibitors, and analyzed for DNA content after 24 h by propidium iodide staining and flow cytometry. The percentage of cells in the G1 or G2/M phase of the cell cycle is indicated. For panels G, H, I, data are the mean±SD of duplicates of a representative experiment out of at least two independent determinations. See also Figure S5.

