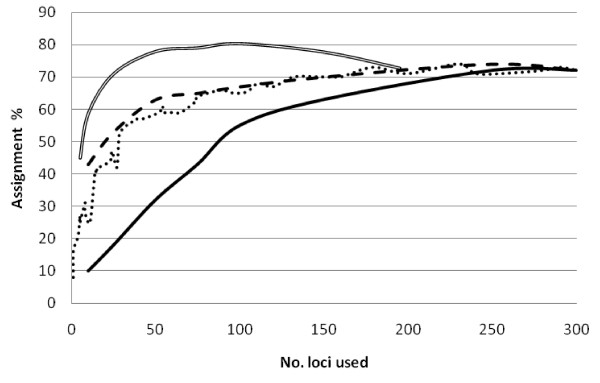
Figure 4.
Correct self-assignment percentage plotted against cumulative number of SNP loci selecting loci randomly (dotted line), the most informative 10, 25, 50, 75, 100, 150, 250 and all 300 loci sorted by global FST (broken line), the least informative 10, 25, 50, 75, 100, 150, 250 and all 300 loci sorted by global FST (solid line), and the most informative 5, 10, 25, 50, 75, 100, 150, 195 loci sorted by the program BELS taking only mapped loci > 1 cM distance from each other (double line).

