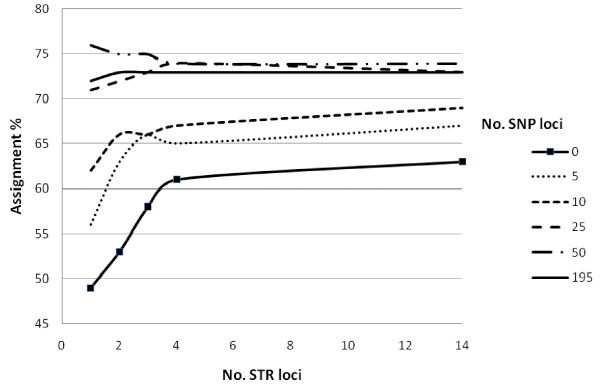
Figure 5.
Correct self-assignment percentage plotted against number of STR loci, taking loci displaying greatest number of alleles first, when combining each STR set with 0, 5, 10, 25, 50 and 195 SNPs starting with the most informative SNPs ranked by the program BELS. Integrated figure legend shows number SNP loci added.

